
This is a guest post by David Graham, practicing physician and financial advisor from Montana. In today’s post he helps us sort out the best asset allocation as we approach and enter retirement. What happens if the market crashes? If there is a bear market, will your portfolio withstand the sequence of return risk (SORR)? Today’s post will help you sort it all out. Take it away, Dr. Graham!
Do Rising Equity Glidepaths or Bond Tents Beat a Fixed 60/40 Portfolio over a 30–Year Retirement?
Rising equity glidepaths and bond tents are styles of glidepaths.
Glidepaths describe the modulation of asset allocation before and after retirement. For example, traditional target date funds decrease stock percentage to or through retirement and retain a conservative—mostly bond—portfolio thereafter.
Your own personal glidepath need not follow a traditional approach. No data support a best practice. Certain specific glidepaths, however, aim to tame the fiercest foe faced early in retirement: sequence of return risk.
Sequence of Return Risk (SORR)
A nest egg is most vulnerable to sequence of return risk (SORR) five years before and 10 years after retirement. SORR describes the long-term detrimental effects initial negative market returns have on portfolio during de-accumulation. When withdrawing from retirement accounts, selling low locks in the losses.
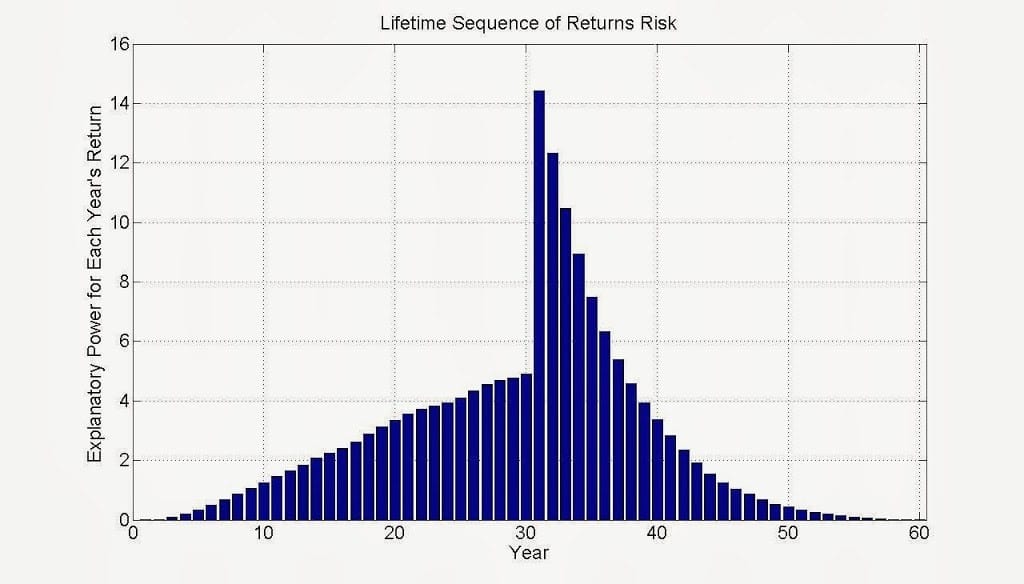
Figure 1 Source: https://www.mcleanam.com/lifetime-sequence-of-returns-risk/
The above graph demonstrates the explanatory power of each year’s return before and after retirement.
Prior to retirement (year 30 in this graph), SORR increases steadily. Upon retirement, SORR peaks dramatically, then evaporates over the next 10-15 years.
Since SORR rapidly wanes after retirement, rising equity glidepaths or bond tents might provide additional market returns. These programmatic increases in stock allocations over time have a positive effect on rising tail sequences and may deliver larger portfolios.
That is, after SORR passes, more stocks means you leave more money when you die.
Rising Equity Glidepath and Bond Tents
With a rising equity glidepath, you increase stock allocation gradually over a number of years during retirement.
Psychologically, however, it is difficult to talk an 80-year-old into more aggressive asset allocations. Perhaps for this reason, attention shifted to bond tents.
A bond tent describes an asset allocation where bond percentage increases before retirement and decreases after, forming an inverted ‘V’ or a tent. Bonds are prescribed as a volatility dampener to reduce SORR.
Perhaps it is easier to talk a 60-year-old into increasing their bond allocation than to talk an 80–year–old into increasing stock allocation. Thus, the bond tent rather than a rising equity glidepath.
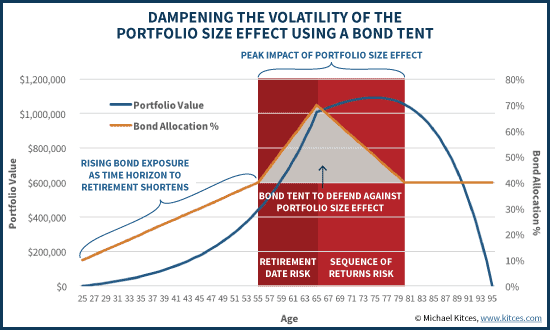
Figure 2 From: https://www.kitces.com/blog/managing-portfolio-size-effect-with-bond-tent-in-retirement-red-zone/
Rising Equity Glidepaths or Bond Tents for a Traditional Retiree
So, does a traditional retiree need a bond tent or a rising equity glidepath?
What asset allocation is ideal before, during, and after retirement to prevent your nest egg expiring before you do? Or, if you have legacy or charitable goals, is there a way to juice your returns?
Let’s compare a couple different styles of rising equity glidepaths with a standard 60/40 stocks to bonds portfolio and see how they do under stress from SORR.
Case Presentation and Assumptions
Assume you have a $2M portfolio invested in US stocks and bonds. Let’s use a 4% withdrawal rate and adjust for 2% inflation.
Actual stock and bond returns from 2000-2010 simulate SORR in this example. Before and after this 10-year period, assume stocks and bonds return either 7% and 3.5% (low returns), respectively, or 9% and 5% (high returns).
Results Without SORR
What if no there is no bear market during retirement?
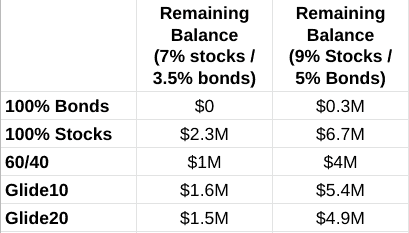
Figure 3 (Results without SORR)
Above, you can see expected portfolio size after 30 years without any market crashes. Both return assumptions (7% and 3.5% for stocks and bonds, respectively, and 9% and 5%) are shown.
Clearly, bonds perform poorly and stocks perform best when assets rise at a continuous rate. Comparing a fixed 60/40 portfolio with a 10- or 20-year rising equity glidepath demonstrates similar results. Glide10 and Glide20 do better than 60/40 as they have higher stock allocations.
Types of Rising Equity Glidepaths
For this model, I am using two different types of glidepaths; Glide10 and Glide20. Glide10 increases to its highest allocation through 10 years, and Glide20 through 20 years after retirement. Some authors suggest that a glidepath over 30 years of a 30 year retirement is too slow, and looking at bar graph in figure 1 we see why.
In addition, previous models have looked at allocations increasing from 30% stocks up to 70% stocks. Further mathematical modeling shows that this allocation is underweight in equities.
In the model demonstrated here, asset allocation is brought to 60/40 five years before retirement. It is held there until retirement and then increases incrementally to 90/10 over either 10 (Glide10) or 20 (Glide20) years after retirement.
A quick note about future expected returns: I demonstrate two different returns. In this scenario, using harsh 2000-2010 returns to model SORR, I wanted to have both low expected returns (7% for stocks, 3.5% for bonds) as well as higher expected returns (9% for stocks, 5% for bonds). Expected returns may likely be higher following a significant period of low returns, but take your pick.
SORR at Year One
What if there is bear at year one?
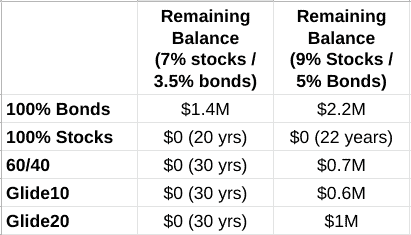
Figure 4 (Results with SORR at year one)
Above, you see the results when disaster strikes the year of retirement. This represents the largest risk to your portfolio’s future according to figure 1.
The 100% bond portfolio actually does the best in this scenario. The 100% stock portfolio survives 20 or 22 years depending on return assumptions.
Using the lower return assumptions (7% and 3.5%), none of the other portfolios survive at year 30. With higher return assumptions, however, 60/40 and Glide10 do pretty similar, and Glide20 does better.
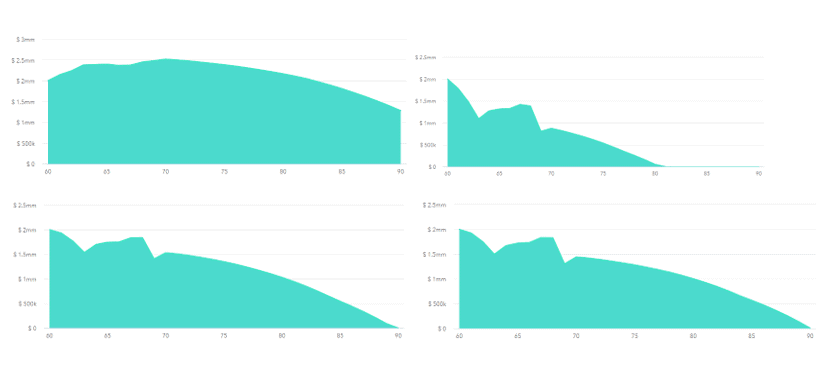
Figure 5 (100% bonds, 100% stocks, 60/40, Glide20. SORR at year one, low assumed return rates)
Visualizing these portfolios with the low assumed return rates, we see 100% bonds (top left) and 100% stocks (top right). Not much to be said about that. Note that years (60-90) is on the x-axis and portfolio size is on the y axis.
The 60/40 portfolio (bottom left) has slightly more left after SORR, though the slope of decline after is more rapid than Glide20 (bottom right).
Let’s continue on looking at SORR starting at different time periods after retirement.
What about SORR Later in Retirement?
What if there is a bear at year six?

Figure 6 (SORR starting at 6 years after retirement)
As seen above, when SORR starts at year 6, an all-stock portfolio yet again performs poorly.
All the other portfolios perform about the same, with 100% bonds winning with low return assumptions, and Glide20 just edging out 60/40 with high return assumptions.
What if there is a bear at year eleven?
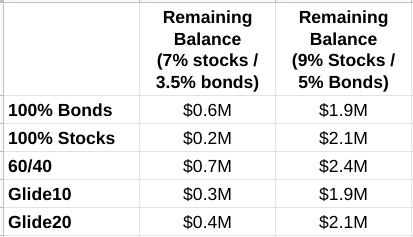
Figure 7 (SORR starting 11 years after retirement)
SORR starts at year 11 above. In this setting, the 60/40 portfolio beats both of the Glide portfolios despite return assumptions. This can be visualized below.
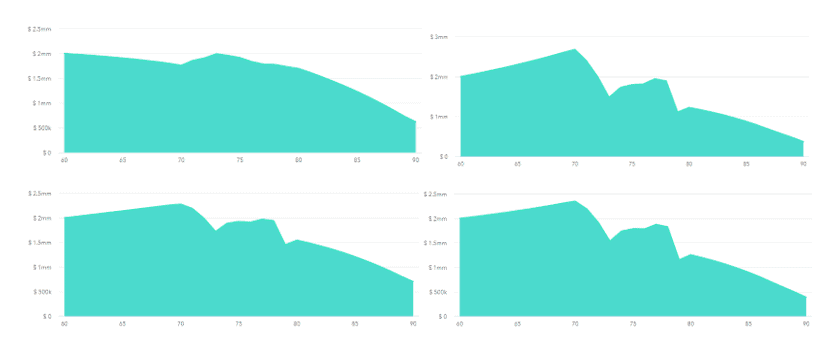
Figure 8 (100% bonds, 100% stocks, 60/40, glide 20. SORR at year 11, low assume return rates)
When SORR strikes at year 11 of retirement with low assumed return rates, 100% bonds (top left) do better than 100% stocks (top right).
The 60/40 portfolio (bottom left) is less effected by the negative returns during SORR than Glide20 (bottom right) which is slowing increasing in stock percentage. As a result, 60/40 has more after SORR has passed and also after 30 years.
Comparison of the Two Glidepaths
Glide10 never performs better than Glide20 except during periods of continuous growth. It is pretty easy to look through this scenario to see why: during continuous growth, a higher percentage of stocks performs better.
However, even when the simulated crash comes at year one, a slower rise to increased equities performed better. Perhaps a Glide15 would be interesting to look at as well.
Comparison of 60/40 to a Rising Equity Glidepaths
Rising equity glidepaths only beats a 60/40 portfolio when a market crash happens early on during retirement AND when expected returns are high. In most scenarios, a 60/40 did quite well.
In fact, it seems likely that a set–it–and–forget–it investment allocation philosophy may just be best over the course of retirement. [TPP: I am telling you…the more we learn about this stuff, the more I realize that a simple set-it-and-forget-it passive index investing technique is the best bet]
Of course, in retirement one could consider ratcheting up stocks in their asset allocation after a market crash as that does increase future expected returns. That is, however, market timing rather than a programmatic approach to asset allocation.
Take Home
The average retiree probably doesn’t want to be 100% in stocks OR bonds when drawing down on their portfolio.
Moreover, keep things simple. As the future is unknown, a 60/40 portfolio is as likely to perform as well as one with a rising equity glidepath or a bond tent over a traditional retirement.
Perhaps the largest criticism of rising equity glidepaths is not one of efficacy, rather effectiveness. How difficult is it to talk an 80-year-old into increasing equity exposure over time rather than doing what is traditional—increasing ownership of bonds instead.
In times of high equity prices, however—as we are in now—consider a 60/40 portfolio 5 years before retirement. Then, sell off bonds for income when stocks are down. This is, in fact, our natural tendency anyway. The result: a slow increase in the stock percentage of overall asset allocation.
TPP’s Comment: I love this post. It made a seemingly difficult topic easy to understand. It also has a great take home message! Work your way towards a 60/40 portfolio as you approach retirement. All the while, you should continue to “set it and forget it” just the way you did during your accumulation phase. Leave a comment below with your thoughts!


Great perspective. I’m at retirement, and SORR is one of my main concerns. Since I’m a little more conservative than most, I’ll take this as a mild endorsement of going into retirement at 50/50 and moving steady as she goes.
I certainly wouldn’t go less than 50/50, but that is just me 🙂
Sorry, but is the assumption on this repeated mention of 60/40 asset allocation in favor of 60% equity or bonds? I read thru twice and can’t seem to tell. Even in the previous question, you said “I certainly wouldn’t go less than 50/50”, but “wouldn’t go less” on what? Equities or bonds? I assumed you meant 60 equities, 50 bonds since that’s what others recommend, but now I’m not sure.